Operating leverage (operating leverage) shows how many times the rate of change in sales profit exceeds the rate of change in sales revenue. Knowing the operating leverage, it is possible to predict the change in profit with a change in revenue.
The minimum amount of revenue required to cover all expenses is called breakeven point, in turn, how much revenue can decrease so that the enterprise works without losses shows margin of financial strength.
A change in revenue can be caused by a change in price, a change in physical volume of sales, and a change in both of these factors.
Let us introduce the notation:
Price operating leverage calculated by the formula:
Rts \u003d (P + Zper + Zpost) / P \u003d 1 + Zper / P + Zpost / P
Natural operating lever calculated by the formula:
Rn \u003d (V-Zper) / P
Considering that B \u003d P + Zper + Zpost, we can write:
Rn \u003d (P + Zpost) / P \u003d 1 + Zpost / P
Comparing formulas for operating lever in price and in kind it can be noticed that pH has less impact. This is due to the fact that with an increase natural volumes at the same time, variable costs also increase, and with a decrease, they decrease, which leads to a slower increase / decrease in profit.
The effect of operating (production) leverage is that any change in sales revenue always generates a stronger change in profit. A number of indicators are used to calculate the effect or strength of a lever. This requires the separation of costs into variables and constants with the help of an intermediate result. This effect is caused by varying degrees of influence of the dynamics variable costs and fixed costs for the financial result when the volume of output changes. By influencing the value of not only variable, but also fixed costs, you can determine by how many percentage points the profit will increase. In other words, the effect of the production lever shows the degree of sensitivity of the profit from the sale to the change in the proceeds from the sale.
The level or strength of the impact of the operating leverage (Degree operating leverage, DOL) is calculated by the formula:
DOL = MP/EBIT = ((p-v)*Q)/((p-v)*Q-FC),
where MP - marginal profit; EBIT - earnings before interest; FC - semi-fixed production costs; Q is the volume of production in physical terms; p - price per unit of production; v - variable costs per unit of output.
The level of operating leverage allows you to calculate the percentage change in profit depending on the dynamics of sales volume by one percentage point. In this case, the change in EBIT will be DOL%.
The greater the share of the company's fixed costs in the cost structure, the higher the level of operating leverage, and consequently, the greater the business (production) risk.
As revenue moves away from the break-even point, the operating leverage decreases, and the organization's financial strength, on the contrary, grows. This Feedback associated with a relative decrease fixed costs enterprises.
Since many enterprises produce a wide range of products, it is more convenient to calculate the level of operating leverage using the formula: DOL = (S-VC)/(S-VC-FC) = (EBIT+FC)/EBIT,
where EBIT+FC =MP, S - sales proceeds; VC- variable costs.
The calculation of the effect of production calculation allows answering the question of how sensitive the marginal income is to changes in the volume of production and sales, and how much it would be enough not only to cover fixed costs, but also to generate profit. It should also be noted that, the impact force of the operating lever:
Depends on the relative value of fixed costs, on the structure of the company's assets, the share of non-current assets. The greater the value of fixed assets, the greater the share of fixed costs;
Directly related to the growth in sales volume;
The higher, the closer the enterprise is to the threshold of profitability;
Depends on the level of capital intensity;
The stronger, the lower the profit and the higher the fixed costs.
The level of operating leverage is not a constant value and depends on a certain, basic implementation value. For example, with a breakeven volume of sales, the level of operating leverage will tend to infinity. Operating lever level has highest value at a point just above the breakeven point. In this case, even a slight change in sales leads to a significant relative change in EBIT. The change from zero profit to any profit represents an infinite percentage increase.
In practice, those companies that have a large share fixed assets and intangible assets ( intangible assets) in the balance sheet structure and high management costs. Conversely, the minimum level of operating leverage is inherent in companies that have a large share of variable costs.
Thus, understanding the mechanism of operation of production leverage allows you to effectively manage the ratio of fixed and variable costs in order to increase the profitability of the company's operations.
The following conclusions can be drawn:
The high proportion of fixed costs narrows the boundaries of mobile management of current costs;
The greater the force of operating leverage, the higher the entrepreneurial risk.
| | | next lecture ==> | |
The effect of operating leverage is based on the division of costs into fixed and variable, as well as on the comparison of revenue with these costs. The action of production leverage is manifested in the fact that any change in revenue leads to a change in profit, and profit always changes more than revenue.
The higher the share of fixed costs, the higher the production leverage and entrepreneurial risk. To reduce the level of operating leverage, it is necessary to seek to convert fixed costs into variables. For example, workers employed in production can be transferred to piecework wages. Also, to reduce depreciation costs, production equipment can be leased.
Methodology for calculating the operating leverage
The effect of operating leverage can be determined by the formula:
Consider the effect of production leverage on practical example. Let's assume that in the current period the revenue amounted to 15 million rubles. , variable costs amounted to 12.3 million rubles, and fixed costs - 1.58 million rubles. Next year, the company wants to increase revenue by 9.1%. Determine how much profit will increase using the force of operating leverage.
Using the formula, calculate the gross margin and profit:
Gross margin \u003d Revenue - Variable costs \u003d 15 - 12.3 \u003d 2.7 million rubles.
Profit \u003d Gross Margin - Fixed Costs \u003d 2.7 - 1.58 \u003d 1.12 million rubles.
Then the effect of operating leverage will be:
Operating leverage = Gross margin / Profit = 2.7 / 1.12 = 2.41
The operating leverage effect shows how much percent will decrease or increase profits for a change in revenue by one percent. Therefore, if revenue increases by 9.1%, then profit will increase by 9.1% * 2.41 = 21.9%.
Let's check the result and calculate how much the profit will change traditional way(without using the operating lever).
When revenue increases, only variable costs change, while fixed costs remain unchanged. Let's present the data in an analytical table.

Thus, profit will increase by:
1365,7 * 100%/1120 – 1 = 21,9%
We will analyze the operating leverage of an enterprise and its impact on production and economic activities, consider the formulas for calculating the price and natural leverage and analyze its assessment using an example.
Operating lever. Definition
Operating lever (operating leverage, production leverage) - shows the excess of the growth rate of profit from sales over the growth rate of the company's revenue. The purpose of the functioning of any enterprise is to increase profits from sales and, accordingly, net profit, which can be directed to increasing the productivity of the enterprise and increasing its financial efficiency (value). The use of operating leverage allows you to manage the future profit from the sales of the enterprise by planning future revenue. The main factors that affect the amount of revenue are: product price, variable, fixed costs. Therefore, the goal of management becomes the optimization of variable and fixed costs, the regulation of pricing policy to increase profits from sales.
Formula for calculating price and natural operating leverage
|
Formula for calculating price operating leverage |
The formula for calculating natural operating leverage |
 where: Op. leverage p - price operating leverage; Revenue - sales revenue; Net Sales - sales profit (operating profit); TVC (Total variable Costs)
– total variable costs; TFC (Total fixed Costs) where: Op. leverage p - price operating leverage; Revenue - sales revenue; Net Sales - sales profit (operating profit); TVC (Total variable Costs)
– total variable costs; TFC (Total fixed Costs)
|
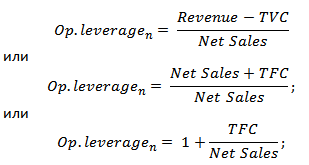 where: Op. leverage n - natural operating leverage; Revenue - sales revenue; Net Sales - sales profit (operating profit); TFC (Total fixed Costs) - total fixed costs. |
What does the operating lever show?
Price operating leverage reflects price risk, that is, the impact of price changes on the amount of profit from sales. shows the production risk, that is, the variability of profit from sales depending on the volume of output.
High operating leverage reflects a significant excess of revenue over sales profit and indicates an increase in fixed and variable costs. The increase in costs may be due to:
- Modernization of existing facilities, expansion of production facilities, increase production staff, introduction of innovations and new technologies.
- Decrease in sales prices of products, inefficient growth in the cost of wages for low-skilled personnel, an increase in the number of defects, a decrease in the efficiency of the production line, etc. This leads to an inability to provide the necessary sales volume and, as a result, reduces the margin of financial safety.
In other words, any costs at the enterprise can be both effective, increasing the production, scientific, technological potential of the enterprise, and vice versa, hindering development.
Operating leverage. How does productivity affect profits?
Operating leverage effect
Operational (production) effect leverage lies in the fact that a change in the company's revenue has a stronger impact on sales profit.
As we can see from the above table, the main factors affecting the size of the operating leverage are variable, fixed costs, and also profit from sales. Let's take a closer look at these leverage factors.
fixed costs- costs that do not depend on the volume of production and sale of goods, they, in practice, include: rent for production areas, wage management personnel, interest on a loan, deductions on a single social tax, depreciation, property taxes, etc.
Variable Costs - costs that vary depending on the volume of production and sale of goods, they include the costs of: materials, components, raw materials, fuel, etc.
Revenue from sales depends primarily on the volume of sales and the pricing policy of the enterprise.
Operational leverage of the enterprise and financial risks
The operating leverage is directly related to the financial strength of the enterprise through the ratio:
Op. Leverage - operating leverage;
ZPF - a margin of financial strength.
With the growth of the operating leverage, the financial strength of the enterprise decreases, which brings it closer to the threshold of profitability and inability to ensure sustainable financial development. Therefore, the company needs to constantly monitor its production risks and their impact on financial ones.
Consider an example of calculating the operating leverage in Excel. To do this, you need to know the following parameters: revenue, profit from sales, fixed and variable costs. As a result, the formula for calculating the price and natural operating leverage will be as follows:
Price operating leverage=B4/B5
Natural operating lever=(B6+B5)/B5

Example of calculating operating leverage in Excel
Based on the price leverage, it is possible to evaluate the impact of the company's pricing policy on the amount of profit from sales, so if the price of products increases by 2%, the profit from sales will increase by 10%. And with an increase in production volumes by 2%, the profit from sales will increase by 3.5%. Similarly, the opposite is true, with a decrease in price and volume, the resulting value of profit from sales will decrease in accordance with the leverage.
Summary
In this article, we examined the operating (production) lever, which allows us to evaluate the profit from sales, depending on the pricing and production policy of the enterprise. High leverage values increase the risk of a sharp reduction in the company's profits in an unfavorable economic situation, which, as a result, can bring the company closer to the break-even point, when profits equal losses.
Operating leverage is a mechanism for managing the profit of an organization based on optimizing the ratio of fixed and variable costs.
With it, you can predict the change in profit depending on the change in sales volume.
The operation of operating leverage is manifested in the fact that any change in revenue from the sale of products always generates a stronger change in profit.
Example:
Profit always grows faster if the same proportions between constants and variables are maintained.
If fixed costs increase by only 5%, then the profit growth rate will be 34%.
Solving the problem of maximizing the rate of profit growth, you can control the increase or decrease of not only variable but also fixed costs and, depending on this, calculate how much% the profit will increase.
In practical calculations, the indicator of the effect of the operating leverage (the force of the operating leverage) is used. ESM is a quantitative assessment of the change in profit depending on the change in the volume of sales. It shows by how much% profit will change with a change in revenue by 1%. Or it shows how many times the profit growth rate is higher than the revenue growth rate.
The effect of operating leverage is related to the level of entrepreneurial risk. The higher it is, the higher the risk. Since with its increase, the critical volume of sales increases and the margin of financial strength decreases.
EOR = = = = 8.5 (times)
ESM = = = 8.5 (%/%)
Using the concept of operating leverage to compare cost allocation options.
Sometimes it is possible to transfer part of the variable costs to the category of fixed ones (ie, change the structure) and vice versa. In this case, it is necessary to determine how the redistribution of costs within a constant amount of total costs will affect financial indicators in order to assess risks.
ZFP \u003d (Vf - Vkr) / Vf
Read also:
Operating leverage is the relationship between a company's total revenue, operating expenses, and earnings before interest and taxes. The action of the operational (production, economic) lever is manifested in the fact that any change in sales proceeds always generates a stronger change in profit.
Price operating leverage(Pc) is calculated by the formula:
Рц = Revenue / Profit from sales
Given that Revenue = Approx. + Zper + Zpost, the formula for calculating the price operating leverage can be written as:
Rts \u003d (Inc. + Zper + Zpost) / Appr. = 1 + Sper / Appr. + Zpost/Appr.
Natural operating lever(Рн) is calculated by the formula:
Рн = (Vyr.-Zper) / Approx. = (Ac + Zpost)/Ac. = 1 + Zpost/Inc.
The strength (level) of the impact of the operating leverage (the effect of the operating leverage, the level of production leverage) is determined by the ratio of marginal income to profit:
EPR = Marginal income / Profit from sales
That. operating leverage shows how much the company's balance sheet profit changes when revenue changes by 1 percent.
The operating lever indicates the level of entrepreneurial risk of a given enterprise: the greater the impact of the production lever, the higher the degree of entrepreneurial risk.
The effect of operating leverage indicates the possibility of reducing costs due to fixed costs, and hence the increase in profits with an increase in sales. Thus, the growth in sales is important factor reducing costs and increasing profits.
Starting from the break-even point, an increase in sales leads to a significant increase in profits, since it starts from zero.
The subsequent increase in sales increases profits to a lesser extent compared to the previous level. The effect of operating leverage decreases as sales increase beyond the breakpoint level, as the base against which the increase in earnings is measured gradually becomes larger. Operating leverage works in both directions, both on increases and decreases in sales. Therefore, an enterprise operating in the immediate vicinity of the critical point will have a relatively large share of the change in profit or loss for a given change in sales.
⇐ Previous12345678910
Didn't find what you were looking for? Use the search:
Read also:
Operating leverage effect is that any change in sales revenue leads to an even stronger change in profit. The action of this effect is associated with the disproportionate impact of conditionally fixed and conditionally variable costs on the financial result when the volume of production and sales changes.
The higher the share of semi-fixed costs in the cost of production, the stronger the impact of operating leverage.
The strength of the operating leverage is calculated as the ratio of marginal profit to profit from sales.
Marginal profit is calculated as the difference between the proceeds from the sale of products and the total amount of variable costs for the entire volume of production.
Profit from sales is calculated as the difference between the proceeds from the sale of products and the total amount of fixed and variable costs for the entire volume of production.
Thus, the size of financial strength shows that the company has a margin of financial stability, and hence profit. But the lower the difference between revenue and profitability threshold, the greater the risk of losses. So:
· force of influence of the operational lever depends on the relative size of fixed expenses;
The strength of the impact of the operating lever is directly related to the growth in the volume of sales;
The force of the impact of the operating lever is the higher, the closer the enterprise is to the threshold of profitability;
The strength of the impact of the operating lever depends on the level of capital intensity;
· the force of the impact of the operating leverage is stronger, the lower the profit and the higher the fixed costs.
Entrepreneurial risk is associated with a possible loss of profit and an increase in losses from operating (current) activities.
The effect of production leverage is one of the most important indicators financial risk, since it shows by what percentage the balance sheet profit will change, as well as the economic profitability of assets when the volume of sales or proceeds from the sale of products (works, services) changes by one percent.
Shows the degree of entrepreneurial risk, that is, the risk of loss of profit associated with fluctuations in the volume of sales.
The greater the effect of operating leverage (the greater the proportion of fixed costs), the greater the entrepreneurial risk.
The strength of the operating leverage is always calculated for a certain volume of sales. As sales revenue changes, so does its impact. The operating lever allows you to assess the degree of influence of changes in sales volumes on the size of the organization's future profits. Operating leverage calculations show how much profit will change if sales volume changes by 1%.
Where DOL (DegreeOperatingLeverage)- the strength of the operating (production) leverage; Q- amount; R- unit selling price (without VAT and other external taxes); V- variable costs per unit; F- total fixed costs for the period.
Entrepreneurial risk is a function of two factors:
1) volatility of quantity output;
2) the strength of the operating leverage (changing the structure of costs in terms of variables and constants, the break-even point).
To make decisions on overcoming the crisis, it is necessary to analyze both factors, reducing the operating leverage in the loss zone, increasing the share of variable costs in the total cost structure, and then increasing the leverage when moving into the profit zone.
There are three main measures of operating leverage:
a) the share of fixed production costs in the total cost, or, equivalently, the ratio of fixed and variable costs,
b) the ratio of the rate of change in profit before interest and taxes to the rate of change in the volume of sales in natural units;
c) the ratio of net profit to fixed production costs
Any significant improvement in the material and technical base towards an increase in the share of non-current assets is accompanied by an increase in the level of operating leverage and production risk.
Types of dividend policy in the company.
Dividend Policy of the company is to choose the proportion between the consumed by shareholders and the capitalized parts of the profit to achieve the goals of the company. Under company's dividend policy is understood as the mechanism of formation of the share of profit paid to the owner, in accordance with the share of his contribution to the total equity companies.
There are three main approaches to the formation of a company's dividend policy, each of which corresponds to a specific methodology for dividend payments.
1. Conservative dividend policy - its priority goal: the use of profits for the development of the company (growth of net assets, increase in the market capitalization of the company), and not for current consumption in the form of dividend payments.
The following dividend payment methods correspond to this type:
a) Residual Dividend Methodology commonly used in the early stages of a company and associated with high level its investment activity. The dividend payment fund is formed from the profit remaining after the formation of its own financial resources necessary for the development of the company. The advantages of this technique: strengthening investment opportunities, ensuring high rates of development of the company. Disadvantages: instability of dividend payments, the uncertainty of their formation in the future, which negatively affects market positions companies.
b) Methodology of fixed dividend payments- regular payment of dividends in a constant amount for a long time without taking into account changes in the market value of shares. At high inflation rates, the amount of dividend payments is adjusted for the inflation index. Advantages of the method: its reliability, it creates a sense of confidence among shareholders in the invariability of the size of current income, stabilizes stock quotes on the stock market. Minus: weak connection with the fin. company results. During periods of unfavorable market conditions and low profits investment activities can be reduced to zero.
2. Moderate (compromise) dividend policy – in the process of profit distribution, dividend payments to shareholders are balanced with the growth of own financial resources for the development of the company. This type corresponds to:
a) methodology for paying the guaranteed minimum and extra dividends- payment of regular fixed dividends, and in the case of successful company activity, also a periodic, one-time payment of additional. premium dividends. Advantage of the technique: stimulation of the company's investment activity when high connection from Finnish results of her activities. The method of guaranteed minimum dividends with premiums (premium dividends) is most effective for companies with unstable profit dynamics. The main disadvantage of this technique: with a long payment of min. the size of dividends and the deterioration of financial.
state of investment opportunities are declining, the market value of shares is falling.
3. Aggressive dividend policy provides for a constant increase in dividend payments, regardless of financial results. This type corresponds to:
a) Method of constant percentage distribution of profits (or method of a stable level of dividends)— establishing a long-term normative coefficient dividend payments in relation to profit (or the ratio of profit distribution to consumed and capitalized parts of it). The advantage of the technique: the simplicity of its formation and a close connection with the size of the profit. The main drawback of this technique is the instability of the size of dividend payments per share, depending on the amount of generated profit. Such instability can cause sharp fluctuations in the market value of shares for certain periods. Only large companies with stable profits can afford to pursue such a dividend policy, since it is associated with a high level of economic risk.
b) The method of constant increase in the amount of dividends, the level of dividend payments per share is to establish a fixed percentage of the increase in dividends to their size in the previous period. Benefit: Possibility of upgrading market value shares of the company due to the formation of a positive image among potential investors. Disadvantage: excessive rigidity. If the growth rate of dividend payments increases and the dividend payout fund grows faster than the amount of profit, then the investment activity of the company decreases. Other things being equal, its stability also decreases. The implementation of such a dividend policy can afford only promising, dynamically developing joint-stock companies.
Operating leverage effect
Entrepreneurial activity is associated with many factors. All of them can be divided into two groups. The first group of factors is related to profit maximization. Another group of factors is associated with the identification of critical indicators in terms of the volume of products sold, the best combination marginal revenue and marginal cost, with the division of costs into variable and fixed. The effect of operating leverage is that any change in sales revenue always generates a larger change in earnings.
In modern conditions at Russian enterprises, the issues of mass regulation and profit dynamics come to one of the first places in the management of financial resources. The solution of these issues is included in the scope of operational (production) financial management.
The basis of financial management is financial economic analysis, within which the analysis of the cost structure comes to the fore.
It is known that entrepreneurial activity is associated with many factors that affect its result. All of them can be divided into two groups. The first group of factors is associated with profit maximization through supply and demand, pricing policy, product profitability, and its competitiveness. Another group of factors is associated with the identification of critical indicators in terms of the volume of products sold, the best combination of marginal revenue and marginal costs, with the division of costs into variable and fixed.
Variable costs that change with changes in the volume of output include raw materials and materials, fuel and energy for technological purposes, purchased products and semi-finished products, the basic wages of the main production workers, the development of new types of products, etc. Fixed (company-wide) costs - depreciation deductions, rent, salaries of the administrative and managerial apparatus, interest on loans, travel expenses, advertising expenses, etc.
The analysis of production costs allows you to determine their impact on the amount of profit from sales, but if you go deeper into these problems, it turns out the following:
- such a division helps to solve the problem of increasing the mass of profit due to the relative reduction of certain costs;
- allows you to search for the most optimal combination of variable and fixed costs, providing an increase in profit;
- allows you to judge the cost recovery and financial stability in the event of a deterioration in the economic situation.
The following indicators can serve as a criterion for choosing the most profitable products:
- gross margin per unit of production;
- the share of gross margin in the price of a unit of production;
– gross margin per unit of limited factor.
Considering the behavior of variable and fixed costs, one should analyze the composition and structure of costs per unit of output in a certain period of time and with a certain number of sales. This is how the behavior of variable and fixed costs is characterized when the volume of production (sales) changes.
Table 16 - Behavior of variable and fixed costs when changing the volume of production (sales)
The cost structure is not so much a quantitative relationship as a qualitative one. Nevertheless, the impact of the dynamics of variable and fixed costs on the formation of financial results with a change in production volume is very significant. Operating leverage is closely related to the cost structure.
The effect of operating leverage is that any change in sales revenue always generates a larger change in earnings.
A number of indicators are used to calculate the effect or strength of a lever. This requires the separation of costs into variables and constants with the help of an intermediate result. This value is usually called the gross margin, the amount of coverage, the contribution.
These metrics include:
gross margin = profit from sales + fixed costs;
contribution (coverage amount) = sales proceeds - variable costs;
leverage effect = (sales revenue - variable costs) / sales profit.
If we interpret the effect of the operating leverage as a change in the gross margin, then its calculation will allow us to answer the question of how much the profit changes from an increase in the volume (production, sales) of products.
Revenue changes, leverage changes. For example, if the leverage is 8.5, and revenue growth is planned at 3%, then profit will increase by: 8.5 x 3% = 25.5%. If revenue falls by 10%, then profit decreases by: 8.5 x 10% = 85%.
However, with each increase in sales revenue, the leverage changes and profits increase.
Let's move on to the next indicator, which follows from the operational analysis - the threshold of profitability (or break-even point).
The threshold of profitability is calculated as the ratio of fixed costs to the gross margin ratio:
Gross Margin = Gross Margin / Sales Revenue
profitability threshold = fixed costs / gross margin
The next indicator is the margin of financial strength:
Margin of financial strength \u003d sales proceeds - profitability threshold.
The size of financial strength shows that the company has a margin of financial stability, and hence profit. But the lower the difference between revenue and profitability threshold, the greater the risk of losses. So:
the strength of the impact of the operating lever depends on the relative magnitude of fixed costs;
the strength of the operating leverage is directly related to the growth in sales volume;
the force of the impact of the operating leverage is the higher, the closer the enterprise is to the threshold of profitability;
the strength of the impact of the operating lever depends on the level of capital intensity;
the strength of the impact of operating leverage is stronger, the lower the profit and the higher the fixed costs.
Calculation example
Initial data:
Proceeds from the sale of products - 10,000 thousand rubles.
Variable costs - 8300 thousand rubles,
Fixed costs - 1500 thousand rubles.
Profit - 200 thousand rubles.
1. Calculate the force of the operating leverage.
Coverage amount = 1500 thousand rubles. + 200 thousand rubles. = 1700 thousand rubles.
Operating lever force = 1700 / 200 = 8.5 times,
Let's assume that on next year 12% growth in sales volume is forecasted. We can calculate by what percentage the profit will increase:
12% * 8,5 =102%.
10000 * 112% / 100= 11200 thousand rubles
8300 * 112% / 100 = 9296 thousand rubles.
11200 - 9296 \u003d 1904 thousand rubles.
1904 - 1500 = 404 thousand rubles
Lever force = (1500 + 404) / 404 = 4.7 times.
From here, profit increases by 102%:
404 — 200 = 204; 204 * 100 / 200 = 102%.
Let's define the profitability threshold for this example. For these purposes, the gross margin ratio should be calculated. It is calculated as the ratio of gross margin to sales revenue:
1904 / 11200 = 0,17.
Knowing the gross margin ratio - 0.17, we consider the profitability threshold.
Profitability threshold \u003d 1500 / 0.17 \u003d 8823.5 rubles.
Analysis of the cost structure allows you to choose a strategy of behavior in the market. There is a rule for choosing profitable options assortment policy - the rule "50: 50".
Cost management in connection with the use of the effect of operating leverage allows you to quickly and comprehensively approach the use of enterprise finances. You can use the 50/50 rule for this.
All types of products are divided into two groups depending on the share of variable costs. If it is more than 50%, then it is more profitable for the given types of products to work on reducing costs. If the share of variable costs is less than 50%, then it is better for the company to increase sales volumes - this will give more gross margin.
Having mastered the cost management system, the company receives the following benefits:
- the ability to increase the competitiveness of manufactured products (services) by reducing costs and increasing profitability;
– to develop a flexible pricing policy, on its basis to increase turnover and oust competitors;
– save the material and financial resources of the enterprise, obtain additional working capital;
- to evaluate the efficiency of the company's divisions, staff motivation.
Operating leverage (production leverage) is a potential opportunity to influence the company's profit by changing the cost structure and production volume.
The effect of operating leverage is that any change in sales revenue always leads to a larger change in profit. This effect is caused by varying degrees of influence of the dynamics of variable costs and fixed costs on the financial result when the volume of output changes. By influencing the value of not only variable, but also fixed costs, you can determine by how many percentage points the profit will increase.
The level or strength of the impact of the operating leverage (Degree operating leverage, DOL) is calculated by the formula:
D OL = MP/EBIT = ((p-v)*Q)/((p-v)*Q-FC)
MP - marginal profit;
EBIT - earnings before interest;
FC - semi-fixed production costs;
Q is the volume of production in natural terms;
p is the price per unit of production;
v - variable costs per unit of production.
The level of operating leverage allows you to calculate the percentage change in profit depending on the dynamics of sales volume by one percentage point. In this case, the change in EBIT will be DOL%.
The greater the share of the company's fixed costs in the cost structure, the higher the level of operating leverage, and consequently, the greater the business (production) risk.
As revenue moves away from the break-even point, the operating leverage decreases, and the organization's financial strength, on the contrary, grows. This feedback is associated with a relative decrease in the fixed costs of the enterprise.
Since many enterprises produce a wide range of products, it is more convenient to calculate the level of operating leverage using the formula:
DOL = (S-VC)/(S-VC-FC) = (EBIT+FC)/EBIT
where S is sales proceeds; VC - variable costs.
The level of operating leverage is not a constant value and depends on a certain, basic implementation value. For example, with a breakeven volume of sales, the level of operating leverage will tend to infinity. The level of operating leverage is greatest at a point just above the breakeven point. In this case, even a slight change in sales leads to a significant relative change in EBIT. The change from zero profit to any profit represents an infinite percentage increase.
In practice, those companies that have a large share of fixed assets and intangible assets (intangible assets) in the balance sheet structure and large management expenses have a large operating leverage. Conversely, the minimum level of operating leverage is inherent in companies that have a large share of variable costs.
Thus, understanding the mechanism of operation of production leverage allows you to effectively manage the ratio of fixed and variable costs in order to increase the profitability of the company's operations.
Previous123456789101112Next
VIEW MORE:
The process of financial management, as you know, is associated with the concept of leverage. Lever is a factor, a small change in which can lead to a significant change in performance. The operating lever uses the relationship ʼʼcosts - production volume - profitʼʼ, ᴛ.ᴇ. it implements in practice the possibility of optimizing profits by managing costs, the ratio of their constant and variable components.
The effect of operating leverage is manifested in the fact that any change in the costs of the enterprise always generates a change in revenue and an even stronger change in profit.
1. Revenue from product sales in the current period is
2. The actual costs that led to the receipt of this revenue,
formed in the following volumes:
- variables - 7,500 rubles;
- permanent - 1500 rubles;
- total - 9,000 rubles.
3. Profit in the current period - 1000 rubles. (10,000 - 7500-1500).
4. Suppose that the proceeds from the sale of products in the next period will increase to 110,000 (+10%).
Then the variable costs, according to the rules of their movement, will also increase by 10% and amount to 8,250 rubles. (7500 + 750).
6. Fixed costs according to the rules of their movement remain the same -1500 rubles.
7. The total costs will be equal to 9,750 rubles. (8 250 + 1500).
8. Profit in this new period will be 1,250 rubles. (11 LLC - 8,250 - 500), which is 250 rubles. and 25% more profit of the previous period.
The example shows that a 10% increase in revenue led to a 25% increase in profits. This increase in profits is the result of the effect of operating (production) leverage.
Operating lever force- This is an indicator used in practice when calculating the rate of profit growth. The following algorithms are used to calculate it:
Operating Leverage = Gross Margin / Profit;
Gross Margin = Sales Revenue - Variable Costs.
Example. We use the digital information of our example and calculate the value of the indicator of the force of the impact of the operating lever:
(10 000 — 7500): 1000 = 2,5.
The resulting value of the impact force of the operating lever (2.5) shows how many times the profit of the enterprise will increase (decrease) with a certain increase (decrease) in revenue.
With a possible decrease in revenue by 5%, profit will decrease by 12.5% (5 × 2.5). And with an increase in revenue by 10% (as in our example), profit will increase by 25% (10 × 2.5), or by 250 rubles.
The impact of operating leverage is greater, the higher the proportion of fixed costs in the total cost.
The practical significance of the effect of operating leverage essentially consists in the fact that, by setting one or another rate of growth in the volume of sales, it is possible to determine in what sizes the amount of profit will increase with the strength of the operating lever that has developed at the enterprise. Differences in the effect achieved at enterprises will be determined by differences in the ratio of fixed and variable costs.
Understanding the mechanism of operation of the operating lever allows you to purposefully manage the ratio of fixed and variable costs in order to increase the efficiency of the current activities of the enterprise. This management is reduced to changing the value of the strength of the operating lever under various trends in the commodity market and stages of the life cycle of the enterprise:
In case of unfavorable commodity market conditions, as well as on early stages the life cycle of an enterprise, its policy should be aimed at reducing the strength of the operating lever by saving fixed costs;
With favorable market conditions and with a certain margin of safety, savings in fixed costs should be significantly weakened. During such periods, the enterprise can expand the volume of real investments by modernizing the basic production assets.
- Gurfova Svetlana Adalbievna, Candidate of Sciences, Associate Professor, Associate Professor
- Kabardino-Balkarian State Agrarian University named after V.I. V.M. Kokova
- OPERATING LEVER POWER
- OPERATING LEVER
- VARIABLE COSTS
- OPERATIONAL ANALYSIS
- FIXED COSTS
The ratio "Volume - Costs - Profit" allows you to quantify changes in profit depending on sales volume based on the mechanism of operating leverage. The operation of this mechanism is based on the fact that profit always changes faster than any change in the volume of production, due to the presence of fixed costs as part of operating costs. In the article with an example industrial enterprise the magnitude of the operating leverage and the strength of its impact are calculated and analyzed.
- Characteristics of approaches to the definition of the concept of "financial support of the organization"
- Financial and economic state of Kabarda and Balkaria in the post-war period
- Features of the nationalization of industrial and commercial enterprises in Kabardino-Balkaria
- Influence of the sustainability of agricultural formations on the development of rural areas
One of the most effective methods financial analysis for the purpose of operational and strategic planning is an operational analysis, which characterizes the relationship of financial performance with costs, production volumes and prices. It helps to identify the optimal proportions between variable and fixed costs, price and sales volume, minimizing entrepreneurial risk. Operational analysis, being an integral part of management accounting, helps the financiers of the enterprise to get answers to many of the most important questions that arise before them at almost all the main stages of the organization's cash flow. Its results may constitute a trade secret of the enterprise.
The main elements of operational analysis are:
- operating lever (leverage);
- profitability threshold;
- stock of financial strength of the enterprise.
Operating leverage is defined as the ratio of the rate of change in sales profit to the rate of change in sales revenue. It is measured in times, shows how many times the numerator is greater than the denominator, that is, it answers the question of how many times the rate of change in profit exceeds the rate of change in revenue.
Let's calculate the amount of operating leverage based on the data of the analyzed enterprise - JSC "NZVA" (Table 1).
Table 1. Calculation of the operating leverage at OJSC NZVA
Calculations show that in 2013. the rate of change in profit was approximately 3.2 times higher than the rate of change in revenue. In fact, both revenue and profit changed upwards: revenue - by 1.24 times, and profit - by 2.62 times compared to the level of 2012. At the same time, 1.24< 2,62 в 2,1 раза. В 2014г. прибыль уменьшилась на 8,3%, темп ее изменения (снижения) значительно меньше темпа изменения выручки, который тоже невелик – всего 0,02.
For each specific enterprise and each specific planning period, there is its own level of operating leverage.
When a financial manager pursues the goal of maximizing the rate of profit growth, he can influence not only variable costs, but also fixed costs by applying increment or decrement procedures. Depending on this, he calculates how the profit has changed - increased or decreased - and the magnitude of this change as a percentage. In practice, to determine the strength of operating leverage, a ratio is used in which the numerator is sales revenue minus variable costs (gross margin), and the denominator is profit. This figure is often referred to as the coverage amount. It is necessary to strive to ensure that the gross margin covers not only fixed costs, but also forms a profit from sales.
To assess the impact of a change in sales revenue on profit, expressed as a percentage, the percentage of revenue growth is multiplied by the strength of the impact of operating leverage (COR). Let's determine the SVOR at the assessed enterprise. The results are presented in the form of table 2.
Table 2. Calculation of the force of the impact of the operating lever on JSC "NZVA"
As shown in Table 2, the amount of variable costs for the analyzed period increased steadily. Yes, in 2013. it amounted to 138.9 percent compared to the level of 2012, and in 2014. - 124.2% compared to the level of 2013. and 172.5% to the level of 2012. The share of variable costs in the total costs for the analyzed period is also steadily increasing. Share of variable costs in 2013 increased compared to 2012. from 48.3% to 56%, and in 2014. - another 9 percentage points compared to the previous year. The force with which the operating lever acts steadily decreases. In 2014 it decreased by more than 2 times compared with the beginning of the analyzed period.
From the point of view of the financial management of the organization's activities, net profit is a quantity dependent on the level rational use financial resources of the enterprise, i.e. the direction of investment of these resources and the structure of sources of funds are very important. In this regard, the volume and composition of the main and working capital and the effectiveness of their use. Therefore, the change in the level of strength of the operating leverage was also influenced by the change in the structure of the assets of NZVA OJSC. In 2012 the share of non-current assets in the total assets amounted to 76.5%, and in 2013. it increased to 92%. The share of fixed assets accounted for 74.2% and 75.2%, respectively. In 2014 the share of non-current assets decreased (to 89.7%), but the share of fixed assets increased to 88.7%.
It is obvious that the greater the share of fixed costs in the total volume of costs, the greater the force of the production lever and vice versa. This is true when sales revenue increases. And if sales revenue decreases, then the force of production leverage, regardless of the share of fixed costs, increases even faster.
Thus, we can conclude that:
- the structure of the organization's assets, the share of non-current assets, has a significant impact on the SVOR. With the growth of the cost of fixed assets, the proportion of fixed costs increases;
- a high proportion of fixed costs limits the ability to increase the flexibility of current cost management;
- with the increase in the force of the impact of the production lever, the entrepreneurial risk increases.
The SVOP formula helps answer the question of how sensitive the gross margin is. Later, by rearranging this formula one by one, we will be able to determine the strength of operating leverage based on price and unit variable costs, and total amount fixed costs.
The strength of the impact of the operating leverage, as a rule, is calculated for a known volume of sales, for a given specific sales proceeds. With a change in sales revenue, the strength of the impact of operating leverage also changes. SIDS is largely determined by the influence of the average industry level of capital intensity as an objective factor: with the growth in the cost of fixed assets, fixed costs increase.
However, the effect of production leverage can still be controlled using the dependence of the SVOP on the amount of fixed costs: with an increase in fixed costs and a decrease in profit, the effect of the operating lever increases, and vice versa. This can be seen from the transformed formula for the force of the operating lever:
VM / P \u003d (Z post + P) / P, (1)
where VM– gross margin; P- profit; Z post- fixed costs.
The strength of operating leverage increases with an increase in the share of fixed costs in the gross margin. At the analyzed enterprise in 2013. the share of fixed costs decreased (since the share of variable costs increased) by 7.7%. Operating leverage decreased from 17.09 to 7.23. In 2014 - the share of fixed costs decreased (with an increase in the share of variable costs) by another 11%. Operating leverage also decreased from 7.23 to 6.21.
With a decrease in sales revenue, an increase in SVOR occurs. Each percentage decrease in revenue causes an increasing decrease in profits. This reflects the strength of the operating leverage.
If, on the other hand, sales revenue increases, but the break-even point has already been passed, then the operating leverage decreases, and faster and faster with each percentage increase in revenue. At a small distance from the threshold of profitability, the SRR will be maximum, then it will start to decrease again until the next jump in fixed costs with the passage of a new point of cost recovery.
All these points can be used in the process of forecasting income tax payments in the course of optimization. tax planning, as well as in the development of detailed components of the commercial policy of the enterprise. If the expected dynamics of sales revenue is sufficiently pessimistic, then fixed costs cannot be increased, since the decrease in profit from each percentage decrease in sales revenue can become many times greater as a result of the cumulative effect caused by the influence of large operating leverage. However, if an organization assumes an increase in demand for its goods (works, services) in the long term, then it can afford not to save heavily on fixed costs, since a large share of them is quite capable of providing a higher increase in profits.
In circumstances conducive to a decrease in the income of the enterprise, it is very difficult to reduce fixed costs. In other words, a high proportion of fixed costs in their total amount indicates that the enterprise has become less flexible, and, therefore, more weakened. Organizations often feel the need to move from one area of activity to another. Of course, the possibility of diversification is at the same time a tempting idea, but also very difficult in terms of organization, and especially in terms of finding financial resources. The higher the cost of tangible fixed assets, the more reasons the company has to stay in its current market niche.
In addition, the state of the enterprise with a high share of fixed costs significantly increases the effect of operating leverage. In such conditions, a decrease in business activity means for the organization a multiplied loss of profit. However, if revenue grows enough rapidly, and the company is characterized by strong operating leverage, then it will be able not only to pay the necessary amounts of income tax, but also to provide good dividends and proper funding for its development.
SVOR indicates the degree of entrepreneurial risk associated with a given business entity: the greater it is, the higher the entrepreneurial risk.
In the presence of a favorable market situation, an enterprise characterized by a greater strength of the operating leverage (high capital intensity) receives an additional financial gain. However, capital intensity should be increased only in the case when an increase in the volume of sales of products is really expected, i.e. with great care.
Thus, by changing the growth rate of sales volume, it is possible to determine how the amount of profit will change with the force of operating leverage that has developed at the enterprise. The effects achieved at enterprises will differ depending on the variations in the ratio of fixed and variable costs.
We have considered the mechanism of operation of the operating lever. Its understanding allows for purposeful management of the ratio of fixed and variable costs and, as a result, to improve the efficiency of the current activities of the enterprise, which actually involves the use of changes in the value of the strength of the operating lever under various trends in the commodity market and different stages of the cycle of functioning of an economic entity.
When product market conditions are not favorable, and the company is in the early stages of its life cycle, its policy should identify possible measures that will help reduce the strength of operating leverage by saving fixed costs. With favorable market conditions and when the enterprise is characterized by a certain margin of safety, the work on saving fixed costs can be significantly weakened. During such periods, an enterprise may be recommended to expand the volume of real investments based on the comprehensive modernization of fixed production assets. Fixed costs are much more difficult to change, so enterprises with greater operating leverage are no longer flexible enough, which negatively affects the effectiveness of the cost management process.
The SIDS, as already noted, is significantly affected by the relative value of fixed costs. For enterprises with heavy basic production assets, high values indicator of the strength of the operating lever is very dangerous. In the process of an unstable economy, when customers are characterized by low effective demand, when the strongest inflation takes place, every percent reduction in sales revenue entails a catastrophic wide-ranging drop in profits. The company is in the loss zone. Management seems to be blocked, that is, the financial manager cannot use most of the options for choosing the most effective and productive managerial and financial decisions.
Implementation automated systems relatively weights fixed costs in the unit cost of production. Indicators react differently to this circumstance: gross margin ratio, profitability threshold and other elements of operational analysis. Automation, with all its advantages, contributes to the growth of entrepreneurial risk. And the reason for this is the tilt of the cost structure towards fixed costs. When an enterprise implements automation, it should carefully weigh its investment decisions. It is necessary to have a well-thought-out long-term strategy for the organization. Automated production, having, as a rule, a relatively low level of variable costs, increases operating leverage as a measure of the involvement of fixed costs. And because of more high threshold margin of financial safety is usually lower. That's why general level The risk associated with production and economic activities is higher with the intensification of capital than with the intensification of direct labor.
However, automated manufacturing offers more opportunities to effectively manage the cost structure than when using predominantly manual labor workers. In the presence of wide choice, the business entity must independently determine what is more profitable to have: high variable costs and low fixed costs, or vice versa. Definitely answer to this question It is not possible, since any option is characterized by both advantages and disadvantages. The final choice will depend on the initial position of the analyzed enterprise, what financial goals it intends to achieve, what are the circumstances and features of its functioning.
Bibliography
- Blank, I.A. Encyclopedia of financial manager. T.2. Management of assets and capital of the enterprise / I.A. Form. - M .: Publishing house "Omega-L", 2008. - 448 p.
- Gurfova, S.A. - 2015. - V. 1. - No. 39. - P. 179-183.
- Kozlovsky, V.A. Production and operational management / V.A. Kozlovsky, T.V. Markina, V.M. Makarov. - St. Petersburg: Special Literature, 1998. - 336 p.
- Lebedev, V. G. Cost management at the enterprise / V. G. Lebedev, T. G. Drozdova, V. P. Kustarev. - St. Petersburg: Peter, 2012. - 592 p.


