A tachometer is a useful tool for counting the RPM (revolutions per minute) of a wheel or anything that spins. The easiest way to make a tachometer is to use an IR transmitter and receiver. When the connection between them is interrupted, you know that something is spinning and you can use the code to calculate the RPM based on the frequency of the communication interruption.
In this article, we will look at how to use an IR transmitter and receiver to make a tachometer using Arduino. The result is displayed on a 16x2 LCD display.
The goal of this project is to create a system with one input and one output. At the input of the device there is a signal that changes from high (+5V) to low (+0V) level when communication is disrupted. According to this signal, Arduino will increment the internal counter value. Then additional processing and calculation is carried out, and when the trigger is interrupted, the calculated RPM will be displayed on the LCD display.
For communication we will use an IR beam from an IR LED connected through a low resistance resistor so that it glows brightly. We will use a phototransistor as a receiver, which “closes” in the absence of light from the IR LED. A computer fan will be placed between the IR transmitter and receiver and turned on. An IR receiver connected via a transistor circuit will generate interrupts. The Arduino LCD interface will be used to output the result, so we can output the final RPM value on the LCD.
Elements:
Arduino UNO
16x2 LCD
Bread board
Trimmer resistor 5 kOhm
Jumpers
SIP connectors
2x 2N2222 NPN transistor
Infrared LED
Phototransistor
10 ohm resistor
Resistor 100 kOhm
Resistor 15 kOhm or 16 kOhm
Computer fan
Detailed list of items
All elements used in the project are listed above, but I will describe the functions of the main elements in more detail.
Arduino UNO
This is the Arduino board that we will use to process the pulses from the IR beam interrupt that indicate the presence of a computer fan blade between the receiver and the sensor. The Arduino will use these pulses along with a timer to calculate the RPM of the fan.
LCD 16x2
Once the Arduino has calculated the RPM, this value will be displayed on the display in a user-friendly manner.
Trimmer resistor 5 kOhm
This trimmer will be used to adjust the contrast of the 16x2 LCD. It provides an analog voltage ranging from 0 to +5V, allowing you to adjust the brightness of the LCD display.
Infrared LED and Phototransistor
The phototransistor turns on when powerful IR light hits it. So when the IR LED is lit, it keeps the phototransistor open, but if the IR LED is covered by a fan blade, for example, then the phototransistor is closed.
2N3904 and 2N3906
These transistors are used to convert the signal level in order to provide output pulses from the phototransistor to the Arduino, in which there are no voltages other than +0 and +5V.
Schematic diagram
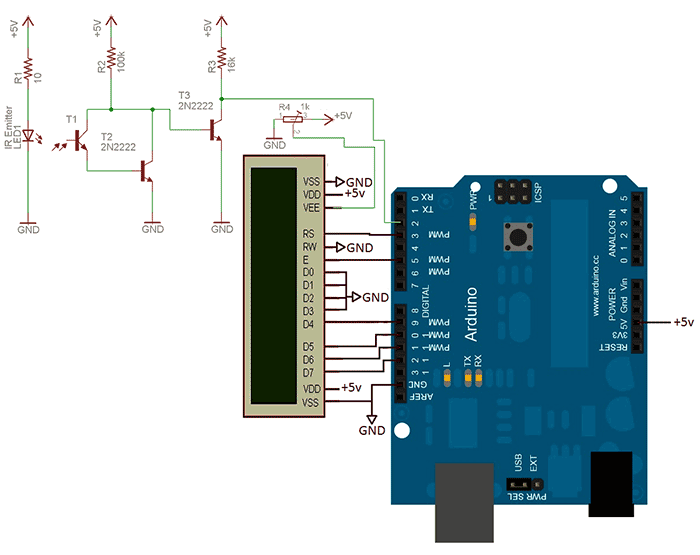
In the circuit, the communication interface with the LCD display is simplified and has only 2 control lines and 4 data lines.
Features of the scheme
16x2 LCD interface
2 control pins and 4 for data transfer are connected from Arduino to the LCD display. This is what tells the LCD what to do and when to do it.
IR beam break circuit
The IR beam break signal goes to the 2nd digital pin of the Arduino. This interrupts the Arduino, allowing it to count the pulse and allowing the tachometer to receive the data.
Arduino LCD library
For this project we will use the Arduino LCD library. Basically we'll just update the RPM value on the second line to the new one.
To prepare, take a look at the code below, which uses this library to display "Hello, World!" on the LCD. In the tachometer we will use similar code, especially: "lcd.print(millis()/1000);".
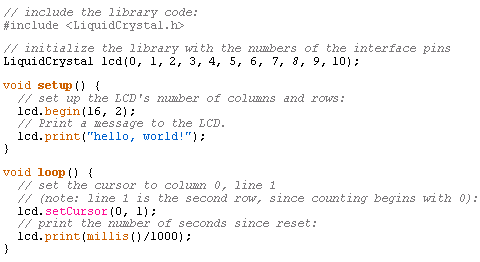
Understand the functions of this LCD library in as much detail as possible before moving forward. It's not too complicated and is well documented on the Arduino website.
Calculating RPM using Arduino
Since we are going to calculate the RPM of a computer fan, we must understand that we are using IR beam interruption for the calculation. This is very convenient, but we must take into account that the computer fan has 7 blades. This means 7 interruptions equal 1 revolution.
If we are tracking interrupts, we need to know that every 7th interrupt means that 1 full rotation has just occurred. If we keep track of the time it takes to complete a revolution, we can easily calculate the RPM.
1st revolution time = P * (µS/revolution)
RPM = rpm = 60,000,000 * (µS/min) * (1/P) = (60,000,000 / P) * (rpm)
To calculate RPM we will use the formula given above. The formula is precise, and the accuracy depends on how well the Arduino can keep track of the time between interrupts and count the number of full revolutions.
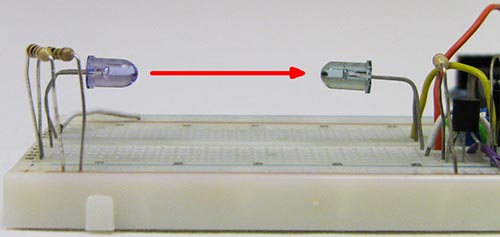
In the photo below you can see all the necessary parts and jumpers as in the diagram.
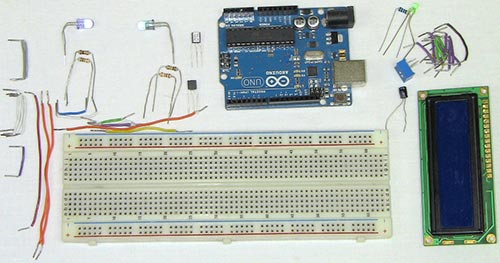
First, connect +5V and the data/control lines of the LCD display. Then LCD display, contrast potentiometer and power LED.
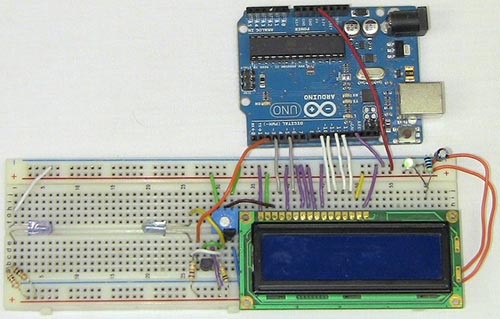
The circuit break of the IR beam is assembled. Try to keep some distance between the IR LED and the phototransistor. This photo shows the distance between the IR LED and the phototransistor where I will place the computer fan.
Enough hardware talk! Let's start doing the firmware/program to see how the device works!
Software part
There are two main parts of the code, which are shown and detailed below:
-Main LCD refresh cycle
-Updating interrupt times
The main cycle counts the revolutions and updates of the LCD display. Since the main loop is a giant while(1) loop, it will always be running, the RPM will be counted, and the LCD will be updated several times per second. The function in the interrupt counts the time between IR interrupts, so you can count the RPM in the main loop.
Remember that a computer fan has 7 blades, so this tachometer is designed to work with those fans only. If your fan or other device only produces 4 pulses per revolution, change the code to "(time*4)".
The two fans operate at approximately 3000 rpm and 2600 rpm, with an error of about +/-100 rpm.
Review of tachometer on Arduino
The fan generates interrupt pulses, and at the output we see RPM. Although the accuracy is not 100%, but approximately 95%, with the cost of the elements being $10, it makes sense to build this tachometer on Arduino.
So what's now?
Beam break-based systems are useful not only for RPM measurements, but also as other sensors. For example, you want to know whether a door is open or closed. Perhaps you want to know if something was passing under the robot. There are many uses for beam cut, and the circuit used here is so simple that there are many ways to improve and build other amazing devices.
Conclusion
Overall, I consider this project a success... But it's a matter of time and experience... One way or another, the system works as intended and quite reliably, and we got the expected result. I hope you enjoyed reading this article and learning how to make your own tachometer using Arduino!
List of radioelements
| Designation | Type | Denomination | Quantity | Note | Shop | My notepad |
|---|---|---|---|---|---|---|
| Arduino board | Arduino Uno | 1 | To notepad | |||
| T2, T3 | Bipolar transistor | 2N2222 | 2 | 2N3904 and 2N3906 | To notepad | |
| R1 | Resistor | 10 ohm | 1 | To notepad | ||
| R2 | Resistor | 100 kOhm | 1 | To notepad | ||
| R3 | Resistor | 16 kOhm | 1 |
Implemented the signal PWM 25 kHz. I don’t have an oscilloscope, but I want to check the result. We make a pulse counter and check the work.
Task
On the base ATmega 328P implement a pulse counter for checking PWM 25 kHz, the accuracy of measurements up to the pulse is not needed, but the order needs to be known.
Solution
The logic of the solution is simple, we track the pulses by which we increment the global variable over the course of a second. The accumulated value will be the frequency of the incoming signal.
To read pulses we will use external interrupts, they are described on the pages 87-96 documentation from the manufacturer. IN Atmega 328P there are two inputs with which we can monitor external interrupts INT0(PD2) And INT1(PD3), to solve the problem we will use INT0.
Configuring external interrupts
The first thing you need to do is configure the port D as an input, and to avoid interference I will connect a pull-up resistor.
To determine which events will trigger the interrupt handler, you need to configure the register ERICA. Bits ISC00 And ISC01 are responsible for INT0, A ISC10 And ISC11 behind INT1. The configuration of monitored events is identical, except for the difference in bits:
00
— Low signal level;
01
— Any logical change in the signal;
10
— Descending edge of the signal;
11
— Rising edge of the signal.
To directly enable interrupt inputs, use the register EIMSK, bits INT0 And INT1 are responsible for the outputs of the same name. Using the above we write the code
Void int0_initial(void) ( DDRD = 0x00; // Port D as input PORTD = (1<< 2); // Включение подтягивающего регистра EICRA = (1 << ISC00) | (1 << ISC01); // Восходящий фронт сигнала EIMSK = (1 << INT0); // Включение входа прерывания sei(); // Разрешаем прерывания }
Handling external interrupts
I have configured the interrupts, now I need to process them. There is an interrupt function for this purpose. ISR(), which needs to specify the interrupt type, in my case INT0_vect. In the function we will increment the variable Tic_Count:
ISR(INT0_vect) ( Tic_Count ++; )
Output of the result
To facilitate the output of the result, so as not to screw the display, I used a non-clean ATmega 328P, A Arduino UNO And Arduino NANO, on board which is the same MK.
As I wrote above, the accuracy of measurements is not so important, therefore I will not set up timers, but simply display the accumulated value of the variable in the main loop once a second Tic_Count and reset it. During these actions I stop processing interrupts.
Below is the complete code for solving the problem with comments:
#define F_CPU 1600000UL #include
Now all that remains is to connect the PWM signal to the PD2 pin and open the serial port monitor. You can also generate and test a signal on one MK.
The output readings are approximately equal to the previously calculated frequency, minor differences are expected due to implementation. For an accurate measurement, it is probably more correct to count the time between pulses and from this calculate the frequency.
For an additional task
Schematic diagram
Scheme on the breadboard

note
In this experiment, we are using a chip for the first time, in this case a 74HC595 output shift register. Microcircuits are useful because they allow you to solve a specific problem without assembling a standard circuit each time.
An output shift register allows us to "save" digital outputs by using only 3 instead of 8. A register cascade would allow us to produce 16, etc. signals through the same three pins.
Before using the microcircuit, you need to carefully study its connection diagram in the datasheet. In order to understand where to count the legs of the microcircuit, there is a semicircular notch on one side of them. If we position our 74HC595 with the notch to the left, then the bottom row will have legs 1-8, and the top row will have 16-9.
In the circuit diagram of our experiment, the legs are arranged in a different order to avoid confusion in the connections. The pin assignments according to the datasheet are labeled inside the image of the microcircuit, the pin numbers are on the outside.
Let us recall that the image of the seven-segment indicator is labeled with the numbers of its legs and their correspondence to the segments.
Sketch
In order to transmit a piece of data that will be sent through the shift register further, we need to apply LOW to the latch pin (ST cp input of the chip), then transmit the data, and then send HIGH to the latch pin, after which the transmitted combination of high and low signal levels.
To transfer data we used the function shiftOut(dataPin, clockPin, bitOrder, value) . The function does not return anything, but it needs to be told as parameters
Arduino pin, which is connected to the DS input of the chip (data pin),
DIY electricity meter using Arduino
In this article you will learn how to make an electricity meter with your own hands, monitor the supply voltage and current.
So, this instrument measures the power current in your home through the current transformer and then performs several calculations to know the wattage value, maximum wattage and the amount of electricity consumed. It's also very easy to add your local tariff and display the cost of electricity used per day.
What you will need for a home electricity meter
Arduino (Uno used in this tutorial)
LCD screen
CT Current Transformer - Talema AC1030 (See below for different options and purchase links)
56 ohm resistor
10μF capacitor
2 x 100KOhm sharing resistors
How to make an electricity meter
First you need to start by assembling components on a CT or breadboard to create your current sensor that produces a signal that your Arduino can understand. Arduino only has analog voltage inputs that measure 0-5V DC, so you need to convert the CT current output to a voltage reference and then scale the reference voltage in the 0-5V range.
Component Assembly
If you are going to be installing your power meter somewhere for a long time, you can solder the resistors and capacitor directly to the CT.
Below is a basic diagram of connecting CT to Arduino: 
The LCD screen already uses analog inputs, but the screen only uses A0. Simply solder three wires from your current sensor to the pins on the shield and use A1 as the sensor input as shown below. 
Once you have all your components connected, you need to connect the sensor to what you want to monitor.
In any case, you need to place the CT around one of the power cables, preferably the red cable (phase). Make sure it is installed around 1 only, as it will not work if it is around both, and it cannot be connected around the ground wire (yellow, green bare wire) as no energy flows through that wire. If you are connecting it to mains power, connect it to one of the output wires after the main switch, as shown below. 
Selecting different components
There are essentially four components that must be selected or properly calculated for you.
Current transformer selection
The first is a current transformer. The Talema AC1030 used here, which can accept rated current of 30A and maximum current of 75A. At 220V it can theoretically handle up to 16.5kW for short periods of time, but it is rated to handle 6.6kW of power continuously, suitable for a small household. To figure out how many amps you need to use, take the maximum continuous power you expect to draw and divide by voltage (usually 110V or 220V depending on your country).
Load resistor calibration
Next you need to determine the value of resistor R3, this will convert your CT current into a voltage reference signal. Start by dividing the primary current (maximum as used above) by the current transformer ratio (available in the data sheet). This should be on the order of 500-5000 to 1. This article ran at 42A with a 1000:1 ratio, giving a secondary current of 0.042A or 42mA. Your analog reference voltage on the Arduino is 2.5V, so to determine the resistance you are using, R = V / I - R = 2.5 / 0.042 = 59.5 ohms. The closest standard resistor value is 56 ohms, so that was used.
Here are a few options on different CTs and their ideal load resistors (in standard sizes):
- Murata 56050C – 10A – 50:1 – 13Ω
- Talema AS-103 – 15A – 300:1 – 51Ω
- Talema AC-1020 – 20A – 1000:1 – 130Ω
- Alttec L01-6215 – 30A – 1000:1 – 82Ω
- Alttec L01-6216 – 40A – 1000:1 – 62Ω
- Talema ACX-1050 – 50A – 2500:1 – 130Ω
- Alttec L01-6218 – 60A – 1000:1 – 43Ω
- Talema AC-1060 – 60A – 1000:1 – 43Ω
- Alttec L01-6219 – 75A – 1000:1 – 33Ω
- Alttec L01-6221 – 150A – 1000:1 – 18Ω
- CTYRZCH SCT-013-000 – 100A
- TOOGOO SCT-013-000 – 100A
Lastly, you need two decoupling resistors to get the 2.5V reference voltage from the Arduino. They should be the same, so R1 = R2, and we don't need much current, which is why these articles use two 100K ohm resistors.
You can now download the sketch to your Arduino if you haven't already, then follow this tutorial to get started.
Update - The code has since been modified to use the millis() function, see end of section for updated code.
Download file: (downloads: 357)
If you don't want to use or don't have an LCD screen, you can also modify the sketch to output to the Arduino IDE serial window as shown below.
Download file: (downloads: 340)
Code update
The code has since been modified to use the built-in millis() function, which calculates the exact cycle time for each cycle to improve accuracy. This only makes about a half a percent improvement in calculation accuracy, but it's the best way to do it.
Here's the improved code: Download file: (downloads: 516) For those of you who read that the millis() function overflows after about 49 days, the code automatically does the reset. 
Calibrate current readings
As mentioned above, since your setup, CT, resistors and input voltage may be different, there is a scaling factor in the sketch that you will need to change before you get accurate results.
To calibrate your energy meter, you need to be sure that the current your meter outputs is measured exactly as you expect. In order to do this accurately, you need to find a calibrated load. This is not easy to find in the average household, so you will need to find one that uses a set and consistent amount of energy. I've used a couple of incandescent bulbs, they come in different sizes and their consumption is pretty close to what's on the label, meaning a 100W bulb uses very close to 100W of actual power since it's almost entirely a purely resistive load.
Plug in a small light bulb (100W or so) and see what load is displayed. Now you need to configure the use of the scaling factor in the calculation line:
Double RMSCurrent = ((maxCurrent - 516) * 0.707) /11.8337
In this case it is 11.8337, it can be higher or lower depending on your application. Either use linear scaling to calculate this figure, or if you're bad at math, play around with different values until the load you've loaded is shown on the energy meter screen.
Once your energy meter is calibrated, you will reset it and leave it to do its job. Below are two images used for low power and high power. 


