In the "Reports" section, there are many different reports for each type of activity. Basically, they are enough for everyday accounting. But sometimes, in order to analyze a particular problem, it is necessary to dig deeper, up to comparing, for example, records in a document and in the registers that it affects. And there are times when standard reports are simply not enough.
For such a deep data analysis or to create your own report in the 1C 8.3 program, there is a "Universal Report". I am going to consider its possibilities in this article.
General description of the universal report in 1C 8.3
First, let's figure out where to find a universal report? If you go to the "Reports" menu, and then click the "Universal Report" link, we will see the following window:
Let's briefly go through its controls.
Finished with the top line.
- Below the most interesting button is the "Show Settings". Here it is better to show with an example.
Instructions for setting up a universal report 1C 8.3
Since we are working in the 1C: "Enterprise Accounting 3.0" program, we are primarily interested in accounting registers. In configuration 3.0, only one is available to us - “accounting and tax accounting”. We select it. Let's see the turnover on 10.01 "Materials" account.
Get 267 1C video lessons for free:
We choose a period. It will be the whole of 2012 for me. Next, click the "Show Settings" button:

To get the names of the materials, select the grouping by the 1st subconto. It is in it that the name is stored, more precisely, a link to the nomenclature.
Go to the "Selections" tab:

Here we need to specify that we only want to see the score 10.01.
If you wish, you can specify here as many selection conditions as you like.
Let's press the generate button and see what we got:

It can be seen that there are too many unnecessary columns in the report. Such as currency accounting, tax accounting and so on. I do not keep these records, and I want to remove these columns from the report.
We go back to the settings and immediately - to the "Indicators" tab:

We remove the flags from those columns that we do not need to display.
On the "Generate" tab, you can specify the field by which sorting will occur. For example, I want my materials to come out alphabetically:

All reports can be opened from the section Main - Reports:
In addition, the required report can be found in the corresponding section. All reports in the section Main - Reports grouped under separate sections of the program. On command All reports a list of all reports of the 1C 8.3 program opens:

The same result can be obtained from the section NSI and administration - Configuring system settings on command Printable reports and processing in a group Reports by hyperlink Reports. You can find the required report in the corresponding section:

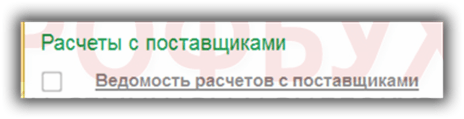
For example, open the section Purchasing - Purchasing reports. A list of purchasing reports will open, grouped by individual groups. Groups are highlighted in green: Procurement, Settlements with suppliers and etc.:

Please note that some of the reports in bold are reports that the developer believes are important for this section.
How to quickly find the desired report in 1C Trade Management 11.2
Method 1
You can use the field to search for the desired report. Search, by entering a few letters. For example - "led" and pressing the button To find. Only those reports that have this combination of letters will remain:

If you enable the checkbox in all sections, then all reports of the program 1C 8.3 UT 11.2 will be found, having a combination of given letters:

If you click on the button Clear in the search field, then return to the default list:

If you click on a hyperlink All reports, then a special form will open in which you can find any report available in UT 11.2. By default, reports will be displayed for the section in which the user is currently working. In our case, these are section reports. Procurement. This form consists of two windows:
- The left window shows all sections;
- On the right - all the reports available in the program:

If you click on the "+" in the selected section, then all groups of this section will open, and in the right window - all reports of this section. If you select a specific group, only the reports of this group will remain:

Method 2
If you do not know in which section the required report is located and do not remember its exact name, you can use the quick search window. Place the cursor on "All sections", enter in the field Search the first few letters: for example, " known"- and a list of reports containing this set of letters will appear in the right window. In our case, these are all statements:


In our case, there will be only one report that has this combination of letters:

You can also use the command More - Find:

Select the desired report and click the button Open(or press the key Enter) - the report form will open:

Changing report settings in 1C UT 11.2
By pressing the button Edit (Change report settings) selected report, a special form will open that allows you to:
- Change its description, but not the name;
- Availability, importance, visibility of the report by default;
- You can also move or copy this report to any other section or sections of the program:

If you set the switch to the position Author only, select a specific user and click the button Write and close, then this report will only be available to that user. This method is usually used for reports that users create themselves:

If you uncheck Visible in dashboards by default and press the button Write and close, then the name of this report will not be visible when opening the report panel:
Report not visible by default:

To open this report, click the button Setting in the reports panel, select the desired report, marked in gray, and enable the checkbox to the left of this report:
The color will change to blue:

Save the changes by clicking the button again. Setting. As a result, the report became visible:

When the button is pressed Setting you can check the box Description of the reports a brief description will then appear below each report. This is convenient, especially if you don't know what the report is for:

Let's move the report to quick access. Click on the right mouse button and execute the command Move to Quick Access:

The report will move to quick access:

The 1C 8.3 UT 11.2 program allows you to rollback, that is, return everything to the default position. For this, the command is used More - Reset my preferences:

Respond to the program's request Yes:

Note that the report is again not visible by default and is greyed out:

Select the report, right-click and select the command Change:

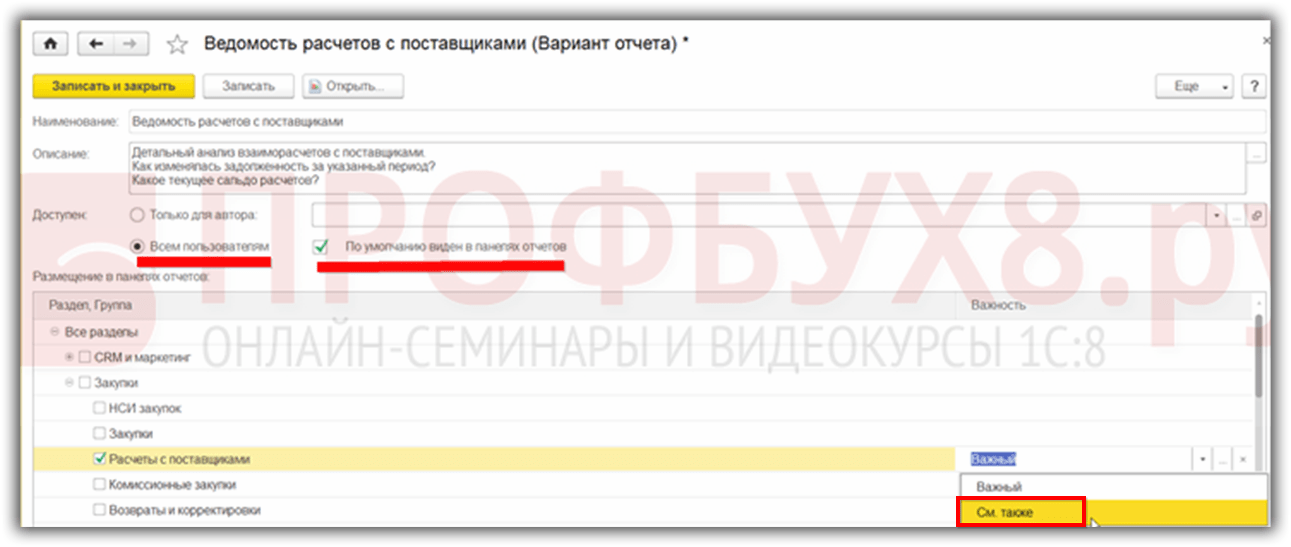
An edit form will open. Set the switch to position To all users turn on the visibility flag in the report panel and change the importance of the report to see also:
Let's write the changes and reopen our report through the section Procurement. The report has moved to the group See also. At the same time, it became “not important”, that is, the selection in bold was removed:

Let's return everything to its initial state and open the report List of settlements with suppliers In chapter Purchasing:

Each report can be customized by clicking the button setting, and also using a group of commands by clicking on the button More:
For more information about the possibilities of working with reports in 1C 8.3, see the following video:
Report settings Accounts payable sheet
Now let's look at the settings of a separate report on the example of a report List of settlements with suppliers. Let's open this report from the section Procurement and generate it by pressing the button Form:

The report form has a report header for quick selection and allows you to generate a report for a certain period for all organizations and suppliers, or for a specific organization and supplier. To do this, enable the appropriate checkboxes and specify a specific organization and / or supplier:

When you press a button Settings, the report settings form will open in a simple form, which can be switched to advanced.
Bookmark selections there is a possibility of additional selections: for the segment of partners and for the counterparty:

How to change the selection condition, how to add a selection, how to group selections according to the AND / OR / NOT condition in 1C ZUP 8.3, see our video tutorial:
Bookmark Fields and sorts you can uncheck/enable the checkboxes for the specified fields. For example, if we do not want to show our debt, then we will uncheck the corresponding box and press the button Close and form. As you can see, there is no column in the report Our debt:

You can sort the report by different fields, and you can specify different sorting for different fields. To do this, using the arrow button, you can move the selected field to the sort window and specify the sort method:

This will sort the fields that have a checkbox next to them. If it is necessary to sort several fields, then the field that is higher in the list, that is, which has a higher priority, is sorted first. Wherein:

For more information about sorting settings in 1C ZUP 8.3, see the following video tutorial:
Bookmark Structure additional groupings can be added. For example, specify that you need to show the object of calculations - specific documents:

We get the following result:

By placing the cursor on any line of the calculation object, you can open the corresponding document.
If you switch to the advanced settings mode, you can add additional selection fields on the tab selections, groupable fields on the tab Structure:

If you select a field and right-click, you can perform a number of other operations:

If you click on the icon with the left mouse button, you can change the placement of the selected field in the report form:

How to set up the necessary structure of reports in 1C ZUP 8.3, see our video tutorial:
Bookmark Registration, which is only available in advanced mode, you can specify how the report should look when certain conditions are met. The figure shows one of the options:

This is what the report looks like now:

Bookmark Structure You can change the structure of the report. The figure shows an example of such a change: the box is unchecked Calculation object and added field Direction of activity:
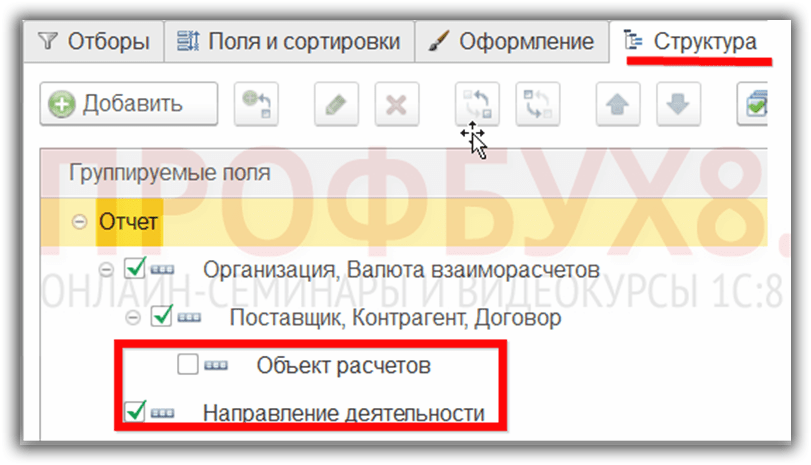
The second table appeared in the report:

For interesting reporting opportunities in 1C ZUP 8.3, see our video tutorial:
Saving report settings
Let's save the created version of the report. To do this, run the command Report Variants - Save Report Variant.
Specify the name of the report, its availability. If we want to change the location of our report, then we need to click the button Further and indicate the section, group, and importance of the report. We will not change anything, so we will immediately save our option on the button Save:

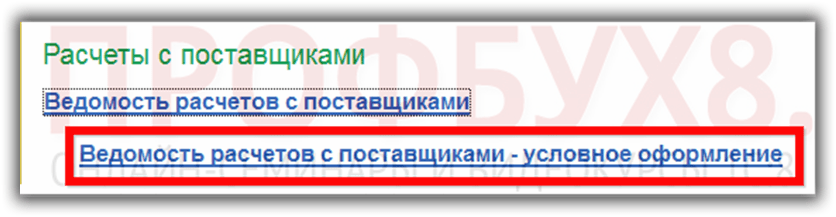
Let's close our report. A new report has appeared in the list of reports, while all settings and selections are saved:
For advanced users who are familiar with SKD – data composition scheme, we can recommend another way. By button More you can run the command Other - Change Report Variant:


Finally, if you want to return to the default settings, then click on the button More command Other - Standard settings.
How to generate a Universal report in 1C 8.3 UT 11.2
A few words should be said about another report that allows you to get data from a variety of objects of the 1C 8.3 UT 11.2 program: directories, documents, registers, etc. - this .
It can be opened from Administration - Printing forms, reports and processing by hyperlink Universal report.
You can also get to this report through the form for all reports by setting the cursor for all sections and entering the first letters in the search field - " University" and pressing the button To find:
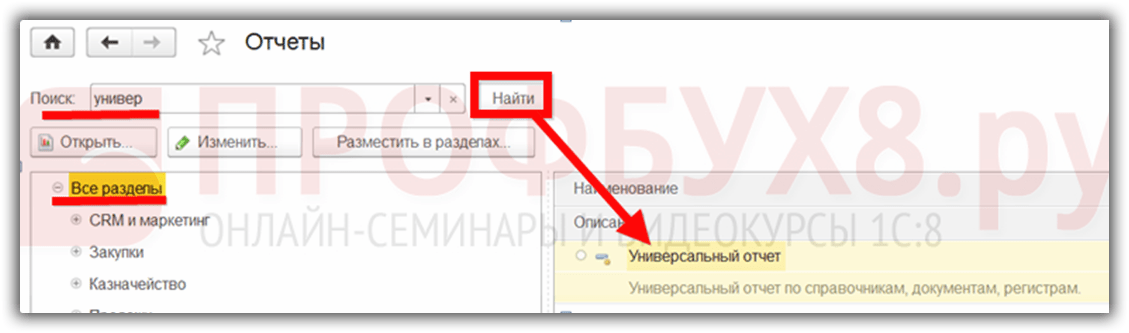
Then press the button Open. This report form will open:

You must first set the report period, select a group of objects, then a specific object and the desired tabular section (it varies depending on the selected object) and click the button Form:

This article discussed various methods for setting up and generating reports in the 1C Enterprise 8.3 Trade Management 11.2 program. Having studied the received information, users of the program will be able to generate reports in a fairly wide range of complexity, which is very convenient.
To make timely and correct management decisions, each organization needs up-to-date information about the availability of goods in warehouses, about its cost, about sales. Trade organizations work with a large number of items and counterparties, and this requires a good setup of analytical accounting and quick receipt of the required information from its data. The article discusses the basic methods of working with standard reports in the standard solution "1C: Trade Management 8" (version 11), built on the basis of the data composition system and provides useful practical recommendations that will be useful to both novice users and those who have switched to the new edition from previous editions.
For example, take a report
- Analysis of the availability of goods;
Setting.
In a collumn Comparison type Nomenclature
- Equals
- Not equal
- Listed
- Not in the list
- In a group Nomenclature;
- Not in a group Nomenclature;
- In a group from the list Nomenclature;
- Not in a group from the list Nomenclature.
Meaning
"Quick Selections"
As the 1C:Enterprise 8 platform develops and the new version 8.2 appears, reports in systems become more flexible, and users have more and more opportunities to customize them to their requirements without the help of programmers.
The new capabilities provided by the data composition system (ACS) allow you to feel the benefits of 1C:Enterprise 8 capabilities when building reports like never before. And, despite the fact that the reporting interface has undergone significant changes (compared to edition 10.3 of the “Trade Management” configuration, hereinafter referred to as UT), the report settings are still available to the average user. Let's take a look at some basic ways to work with them.
The first thing you can pay attention to is quick selections. They allow you to display data in the report according to certain values of the report fields according to the wishes of the user.
For example, take a report Analysis of the availability of goods in UT. We note right away that the entire demonstration of the capabilities of reports in UT 11 will take place on the example of two reports:
- Analysis of the availability of goods;
- Revenue and cost of sales.
Selection by some fields can be done either directly in the report form or by clicking the button Setting.
In a collumn Comparison type The user can select different comparison conditions. For example, for the field Nomenclature You can choose from the following types of comparison:
- Equals- the report will be built only for the selected nomenclature position;
- Not equal- the report will be built for the entire range, except for the selected position;
- Listed- the report will be built according to the list of nomenclature positions;
- Not in the list- the report will be built for the entire range, except for the selected items;
- In a group- the report will be built on all the nomenclature located in the selected folder of the directory Nomenclature;
- Not in a group- the report will be built on the entire nomenclature, except for the items located in the selected folder of the directory Nomenclature;
- In a group from the list- similar to comparison In the list, only folders in the directory are selected as list values Nomenclature;
- Not in a group from the list- similar to comparison Not in the list, only folders in the directory are selected as list values Nomenclature.
The checkbox (tick) to the left of the selection field indicates that the selection by this field is “on”, i.e. it is taken into account by the report.
Unchecked fields are not taken into account even if you have selected certain values for these fields.
Depending on the selected type of comparison in the column Meaning a specific element or folder (group) of the directory, or a list of elements or folders is indicated.
Quick selections are available in all solutions based on the 1C:Enterprise 8 platform.
An example of a simple change in report settings
To view/change the report settings, go to the menu All actions - Change option.
Before us opens the settings window for the selected report option.
The structure of the report is displayed at the top of the window. In fact, this is a visual display of groupings of rows and columns of the report, i.e. in what order the analytics data will be displayed in the report in rows and columns.
The lower part of the window displays those related to the report as a whole (if the top level is selected in the report structure). Report), or to a certain grouping of rows or columns of the report (if the grouping is selected at a level below), settings for displaying information and designing fields.
Example 1
Step 1. We need to remove the grouping by item characteristics, leaving only the grouping by item. To do this, in the upper part of the report settings window, click on the field Nomenclature, Characteristic. At the bottom of the window, go to the tab Groupings.
Select a field Characteristic and click on the button Delete command panel.
Confirm changes to the report settings by clicking on the button Finish editing in the lower left corner of the screen.
Step 2 After removing the characteristic, our task, according to the conditions of the example, will be to add a price group. According to the meaning, this grouping should go a level lower than the grouping by stock, but a level higher than the grouping by item. Therefore, in the structure of the report, we select a grouping Stock.
By clicking on it with the right mouse button, in the context menu, select the command New grouping.
In the grouping field editing window that opens, select Nomenclature.Price group.
By clicking on the button OK, we will see that a new grouping has been added to the report, subordinate to the grouping Stock.
Now let's select the grouping by item and, without releasing the right mouse button, drag it inside (ie below) the grouping by price group. We will get the structure shown in Figure 1. The result of setting up the report is shown in Figure 2.
Rice. 1. The resulting report structure
Rice. 2. Result of report customization
Working with custom fields
Let's now take a closer look at the new reporting options in the 1C: Trade Management 8 program.
In the form of editing the structure and settings of our report, pay attention to the tab Custom fields.
Before that, we added fields to the report, the list of which was predefined by the developer. With this tab, we can create our own fields we need - field-select or Field expression.
Example 2
|
Let's customize the report "History of sales" (version of the report "Revenue and cost of sales"). Let's display data on sales in the context of partners and nomenclature. Suppose that our company is engaged in the sale of goods in Moscow and in the regions. Thus, each client in the infobase belongs to a certain geographic region (props "Business region" of the directory "Partners"). We can easily group sales data in a report by regions, but what if we are interested in more aggregated statistics, in particular, the answer to the question “How many goods were sold in Moscow, and how many in all other regions combined”? This is where custom fields come in handy. |
Step 1. Let's open the report. Let's go to the report structure settings form ( All actions -> Change variant). Let's delete in turn all the groupings previously created in the report - to do this, select each of them and click on the button Delete command bar, or use the DEL key.
Just like in the previous example, let's add a grouping to the report by partner, and then by product. We already know how to do it, so it won't take much time.
Step 2 Let's create a new custom field. Let's open a bookmark Custom fields and run the command Add -> New field-select.
Let's name our new field - Region in general.
Let's click on the button Add. In a new line, click on the button in the column Selection. In the selection editing form that appears, add a selection by field Partner.Business region. Choose the type of comparison Equals, meaning - Moscow.
Let's click on the button OK, after which we will return to the custom field editing window. Next, click on the button in the column Meaning and in the data type selection list that appears, select Line and write as value Moscow.
Let's repeat the operation. Let's add another row to the table. This time for field selection Partner.Business region choose the type of comparison Not equal.
Returning to the custom field editing window, in the column Meaning write Other regions(See Fig. 3).
Rice. 3. Custom Field Editing
Let's click on the button OK. Our new field is ready.
Step 3 Let's add our new field to the report structure. Highlighting the top level Report in Structure, add a new grouping. In props Field choose Region in general.
Drag the grouping by partner and its subordinate grouping by product range into the newly created grouping with the mouse.
Let's generate a report and look at the result (shown in Fig. 4).
Rice. 4. The result of the report generation
Selection and sorting
Let's return to the window for editing the structure and settings of the report and pay attention to the tabs Selection and Sorting.
If the root element is selected in the report structure ( Report), then the settings made on these tabs will apply to the entire report as a whole. If some report grouping is selected, then the settings will apply only to it.
Example 3
As a result, the report Sales history only those implementations will get where the manager is specified Ivanov Ivan Fyodorovich.
Example 4
Save the changes made
If you change the structure of a report, you can always save it using the command All Actions -> Save Variant.
In the form of saving a variant, using the switch, you can select Save to existing report variant(instead of one of the options already available), or Save the new version of the report.
We have considered in detail the settings of reports implemented on the basis of ACS. Now let's look at more subtle and detailed settings for report options. The window of "advanced" report variant settings is called by the command "More" - "Other" - "Change report variant".
The window for changing a report variant is divided into two parts:
1. The structure of the report.
2. Report settings.

The structure section of a report variant is similar to the "Structure" tab of the standard report settings. The purpose and configuration of groupings is discussed in detail in part 1 of the article.
The structure table of the report variant, in addition to the column with groupings, contains several additional columns:
The report variant settings section gives the user ample opportunity to configure the report to suit their needs. It almost completely coincides with the standard report settings discussed in Part 1. Let's look at all the tabs of the section and note the differences.
The settings section consists of the following tabs:
1. Options. Contains the ACS parameters available to the user.
ACS parameter - some value used to get report data. It can be a condition value for data selection or validation, as well as an auxiliary value.
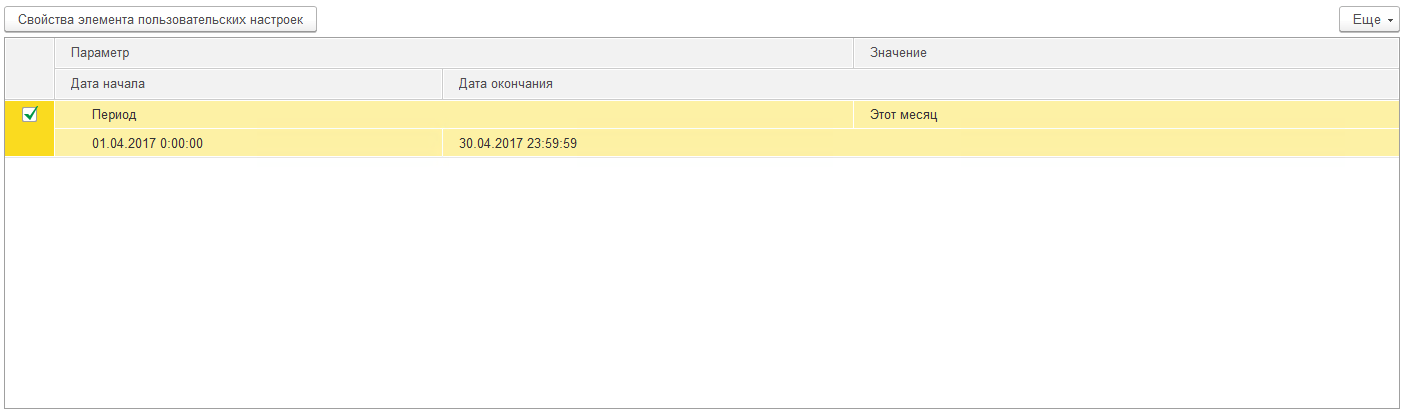
The table of parameters is presented in the format "Parameter" - "Value". If necessary, you can change the parameter values. Clicking on the "User Settings Item Properties" button opens the item's user settings.

In this window, you can choose whether the element will be included in the user settings (i.e., visible to the user when setting up the report), set the element's presentation and editing mode (quick access in the report header, normal in the report settings and inaccessible).
Custom settings element properties also have grouping fields, margins, selections, and conditional styling elements.
2. Custom fields. Contains fields that the user himself forms based on the data selected by the report.

The user can add two types of fields:
- New selection field...
- New expression field...
Selection fields allow you to calculate a value based on a specified condition. The selection field editing window contains the field title and a table in which the selection, value and presentation of the field are specified. Selection is a condition, depending on which the desired value will be substituted.

For example, let's calculate an estimate of the number of sales. We will assume that if less than 10 units of goods are sold, little is sold, and if more than 10 units, a lot is sold. To do this, we will set 2 values of the calculated field: the first one will be with the selection "Number of products Less than or equal to "10"", the second with the selection "Number of products More than "10"".
Expression fields allow you to calculate a value using arbitrary algorithms. They can use the functions of the query language and the built-in 1C programming language. The expression field editing window contains two fields for expressions of detailed and summary records. Total records are groupings configured in the "Report Structure" area, they must use aggregate functions ("Sum", "Minimum", "Maximum", "Quantity").

For example, let's calculate the average discount percentage. The average discount percentage is calculated using the formula: [Amount of sales without a discount] - [Amount of sales with a discount] / [Amount of sales without a discount]. It must be remembered that the amount of sales without a discount can be zero, so we use the SELECT operator to check. We get the following expressions:
· For detailed entries:
Choice
When [Sum of sales without discount] = 0
Then 0
Else [Sales without discount] - [Sales with discount] / [Sales without discount]
End
· For summary entries:
Choice
When Amount([Amount of sales without discount]) = 0
Then 0
Otherwise Amount([Amount of sales without discount]) - Amount([Amount of sales with discount]) / Amount([Amount of sales without discount])
End
As mentioned earlier, in the expression of the total records, we use the aggregate function "Sum".
3. Grouped fields. Contains fields by which the result of the report variant will be grouped. Grouping fields are configured separately for each of the groupings, but you can set common grouping fields for a report variant if you select the “Report” root in the structure tree. You can add a field from the report result, a custom field, or select an auto field, then the system will select the fields automatically. This tab also allows you to change the order of grouped fields.

4. Fields. Contains the fields that will be displayed in the result of the report variant. The fields are configured separately for each of the groupings, but you can set common fields for a report variant if you select the “Report” root in the structure tree. You can add a field from the report result, a custom field, or select an auto field, then the system will select the fields automatically. This tab also allows you to change the order of the fields.
Fields can be grouped to logically highlight any part of the report or set up a specific column layout. When adding a group, the "Location" column becomes active and allows you to select one of the location options:
- Auto - the system arranges the fields automatically;
- Horizontally - the fields are arranged horizontally;
- Vertically - the fields are arranged vertically;
- In a separate column - the fields are located in different columns;
- Together - the fields are arranged in one column.

5. Selection. Contains the filters used in the report variant. Setting up filters was discussed in detail in part 1 of this article. Filters are configured separately for each of the groupings, but you can set general filters for a report variant if you select the “Report” root in the structure tree.

6. Sorting. Contains the sort fields used in the report variant. Setting up sorting fields was discussed in detail in part 1 of this article. Sorting is configured separately for each of the groupings, but you can set common sorting fields for a report variant if you select the “Report” root in the structure tree.

7. Conditional design. Contains conditional design elements used in a report variant. Setting up conditional formatting was discussed in detail in part 1 of this article. Conditional design is configured separately for each of the groupings, but you can set common elements of conditional design for a report variant if you select the “Report” root in the structure tree.

8. Additional settings. Contains additional report design settings. Allows you to select the general appearance of the report, the location of fields, groupings, attributes, resources, totals, set chart settings, control the display of the title, parameters and selection, determine the position of resources and fix the header and columns of groupings of the report variant.

In conclusion, I would like to note that the report settings can not only be saved as a report variant, but also uploaded to a file (menu "More" - "Save settings"). To download, select "Load settings" and select the saved file. Thus, we can transfer report variant settings between different databases that have the same configuration.

Based on this, we can summarize that the user can not only customize the report to suit his needs, but also save his settings and use them in the future if necessary.
In this article, I will show various examples of how typical reports are configured in 1C:Enterprise 8 configurations.
For example, let's analyze the settings for accounting reports (OSV by account) and management reports (Balances and availability of goods) in 1C: Integrated Automation 2.0 (in other configurations, everything is similar).
Setting up a balance sheet
Setting grouping fields
The settings window consists of several tabs, the grouping of lines is configured on the first tab:

The composition of the report groupings is determined by the number of rows in the table; it is also necessary to check the box in the row. In the screenshot above, we see that with this setting, all information in the report will be grouped by employees. Let's add another grouping as an example, click Add:

In the window that opens, the program offers all available fields for the selected SALT account. But since Since these are fields of reference type, we can select not only them directly, but also their nested fields. For example, let's choose the gender of employees:

Let's move the grouping by gender higher in the hierarchy than the grouping by employees and reformat the report:

Now disable grouping by employees:

Let's get another look:

Now let's change the frequency of the output data, for example, monthly:

Let's reformat:

Selections in the report
On the second tab of the settings, various selections are set:

We can use the selections that the system offers automatically (by department and employee), or we can add our own filter. For example, by gender of employees:

On the third tab, the composition of the numerical indicators displayed in the report is selected:

Additional fields in reports
On the next tab, we can add additional fields to the report (for example, we will place them in separate columns):

Add the date of birth of employees:

A new column has appeared in the report:

Sorting in reports
On the penultimate tab, the fields by which it is necessary to sort in the report are indicated, set the sorting, for example, in ascending order of the date of birth:


Conditional report formatting
On the last tab, various design features are set. For example, we can change the color scheme of the report:


You can also manipulate the background color, text color, font, column width and height, etc.
For example, let's add another design element and select all employees who were born before January 01, 1970:

On the first tab, set the background color:

On the second tab, set the selection of employees by date of birth:

On the third, select the fields to be formatted (if not selected, the design will be applied completely to the entire line):

On the last tab, you can choose in which area of the report to use the design. In our case, it is irrelevant, because. the selected field Employees we have only in the grouping:

The result is a table of design elements:

Let's reformat the report:

In the report settings, you can also choose whether to display the title, units of measure (if the report has an item) and captions. Let's add captions:

Setting up the Inventory and Availability report

First of all, switch the settings view to extended to see all available options.
On the first tab, various selections are configured (you can use the ones suggested by the system or add your own using the button of the same name):

On the second tab, additional settings are configured. fields displayed in the report (additional columns) and sorting fields are selected:

On the third tab, conditional design elements are configured (similar to the previous report):


On the last tab, the report structure is configured (the list of groupings of rows and columns):

For example, let's change the structure a little - we will make the characteristic a separate nested grouping of the item.
To do this, select the grouping with the nomenclature and add a nested grouping:

Select the grouping field - characteristic:

Now we will remove the characteristic from the grouping by nomenclature, to do this, click on it 2 times:

In the window that opens, remove the flag for using the field:

We got the required structure:

Let's reformat the report:

Here we see that for most of the products the field was left empty (because the characteristics are not used in these products), but at the same time there are those where we got what we wanted.
All changes made to the reports can be saved (so as not to configure each time).
In the accounting reports here:

And in management like this:

In other accounting and management reports (and payroll), too, everything happens in a similar way.


 in the configuration?")


